Query Pack
Ten queries cover KPI summary, route-change drivers, assignment errors, inventory delay, closeout, follow-up, capacity, re-service, reporting effort, and the 90-day action list.
SQLOpen SQLOperations Analytics
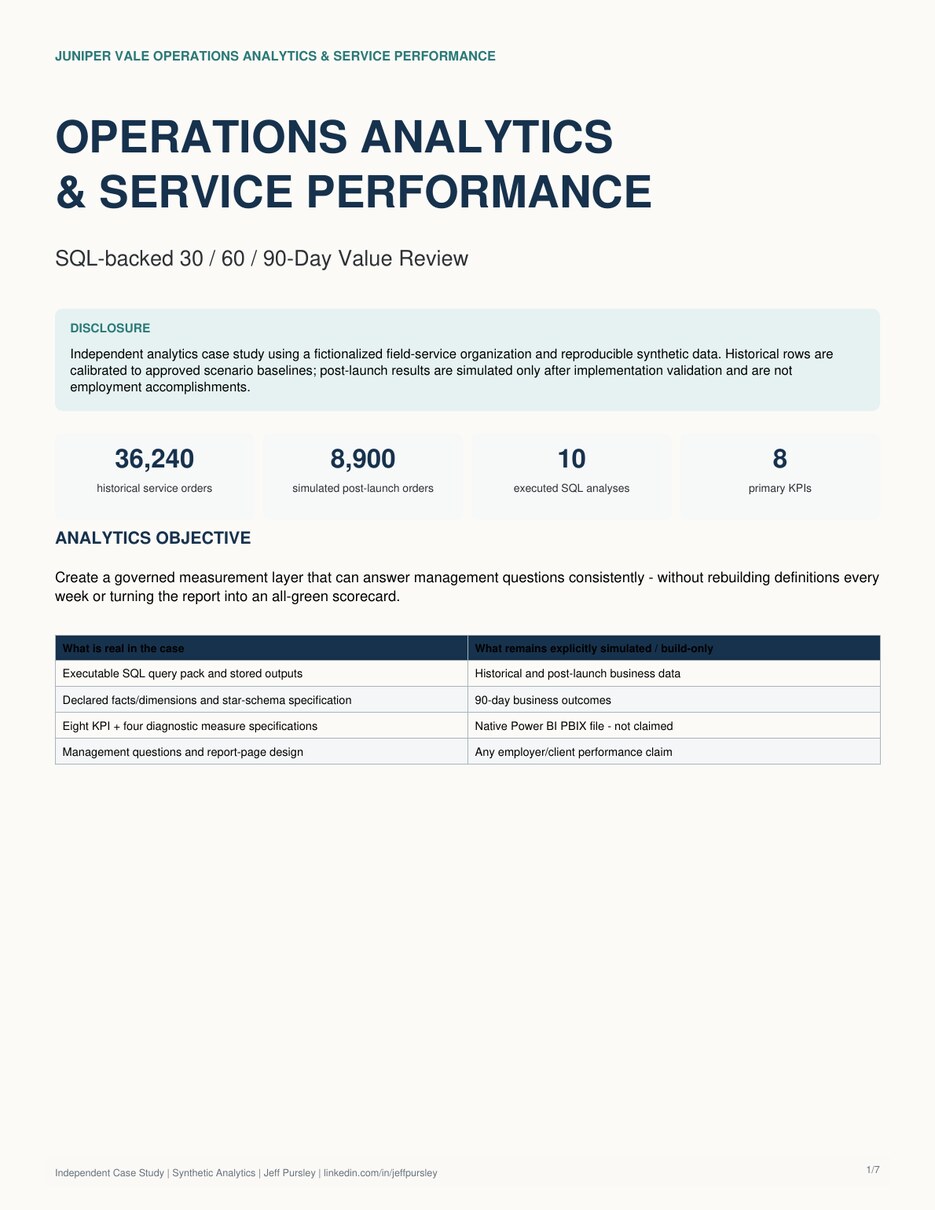
The analytics case uses the same service model, KPI definitions, SQL queries, and 30/60/90-day review to turn operational data into management action.
The analysis uses consistent data grain and KPI rules so managers do not rebuild the same numbers differently each week.
Ten queries cover KPI summary, route-change drivers, assignment errors, inventory delay, closeout, follow-up, capacity, re-service, reporting effort, and the 90-day action list.
SQLOpen SQLThe workbook defines table grain, relationships, KPI/DAX measures, management questions, and six report pages.
XLSXDownload workbookRoute stability, closeout completeness, and reporting effort still need attention. The recommended response is specific to those issues rather than a broad redesign of the process.
The 30/60/90 operating results are scenario results. The SQL, model design, KPI definitions, and analysis are the portfolio work.